After experiencing poor website and traffic results with an ad agency, a New Mexico-based eCommerce business approached Kinga Dow Productions for help. When I first took over the project in January 2016, my first question was: “Can I look at the Google Analytics to understand how your website is performing?”
What I discovered was that while the ad agency had created many paid media (Adwords and Facebook ads) reports, what they failed to do was set up Google analytics to track the raw data.
This should’ve been one of the first things that the agency did. But since they didn’t, our team immediately connected the eCommerce website to Google Analytics. Then we set up all the conversion points for eCommerce and all other “call to action” buttons. We also set up Google Search Console and connected both platforms together.
Once this was established, we needed some time to wait for the data to populate.
In the meantime, I also made sure my client had all of their social media accounts connected and up-to-date. Needless to say, we started working really hard on making all of the channels work for the client to generate more traffic and ultimately, more sales.
This is how our client’s Traffic Channels Report looked at the end of February – 45 days into our engagement with them.
Traffic Channels, February 2016 Report
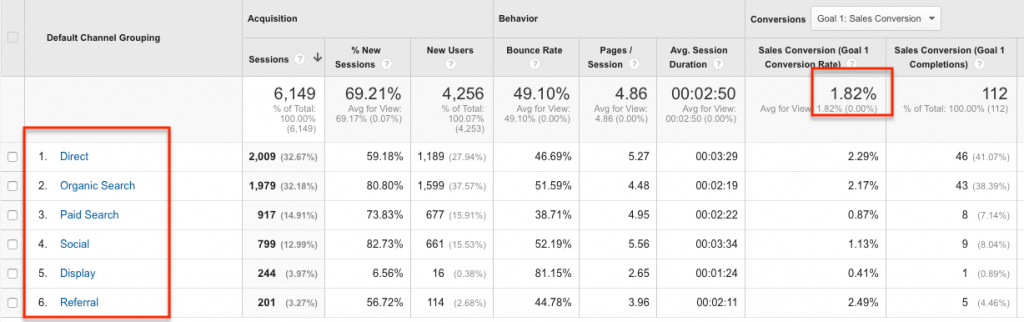
- Direct – Everyone who comes to the website directly by typing in your site’s url
- Organic Search – Everyone who comes to the website from search engines
- Paid Search – All the traffic that is directed from Google, Bing or Yahoo Ads
- Social – Traffic coming from all the social media accounts
- Display – All the traffic that comes from the Facebook right bar advertising
- Referral – All the traffic that is referred by other websites
Once I analysed this report after a full month of collecting data, I got a pretty good idea how the site was performing and it was time to start making some major adjustments.
Overall the conversion rate for February was low as the average was 1.82%.
As I digged deeper into the report, I wanted to see how the Social Media Channels were performing and when I looked at the stats, they were not impressive at all. Side Note: Typically, Social doesn’t yield high conversions because followers are typically less engaged than someone who is searching for your product or service on Google, for example. They typically have purchase intent, whereas a social media follower doesn’t necessarily have that same intent.
Social Media Channels, February 2016 Report
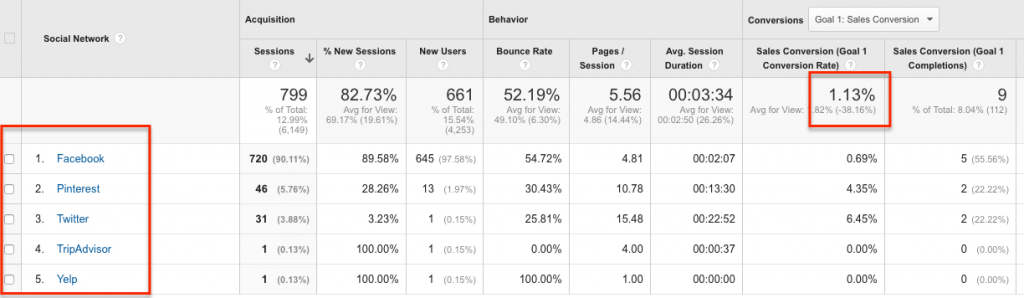
The overall Sales Conversion rate for social media was very low at 1.13%.
However, as we continued to test and learn, at the end of March, we could see an impactful difference in sales.
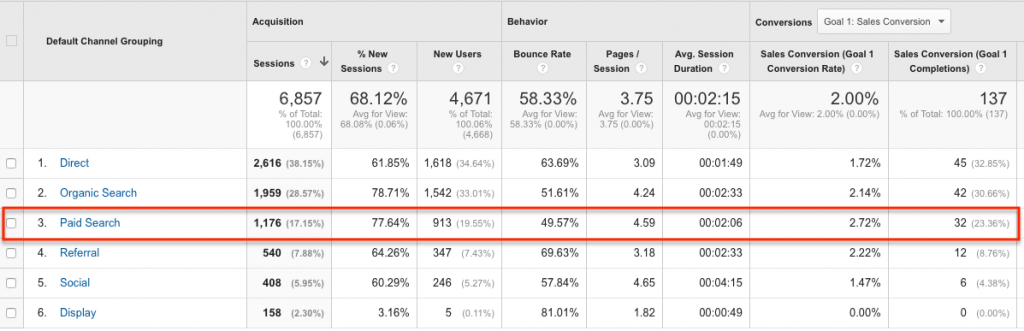
Traffic Channels, March 2016 Report
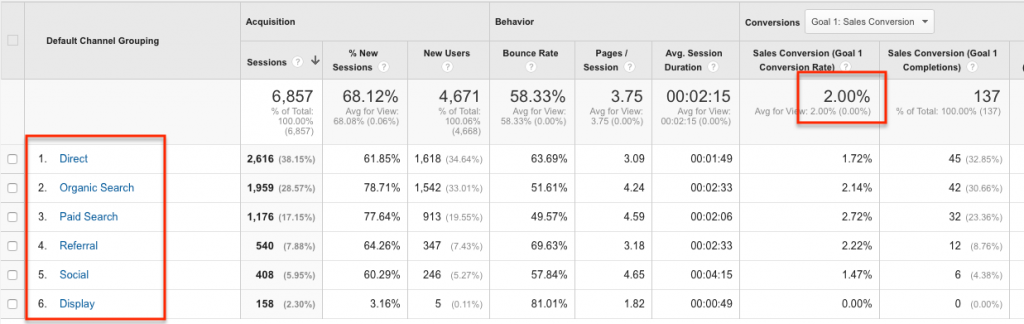
During just one month, the conversion rate went from 1.82% to 2.00%; not much yet, but it was a shift in the right direction.
Social Media Channels, March 2016
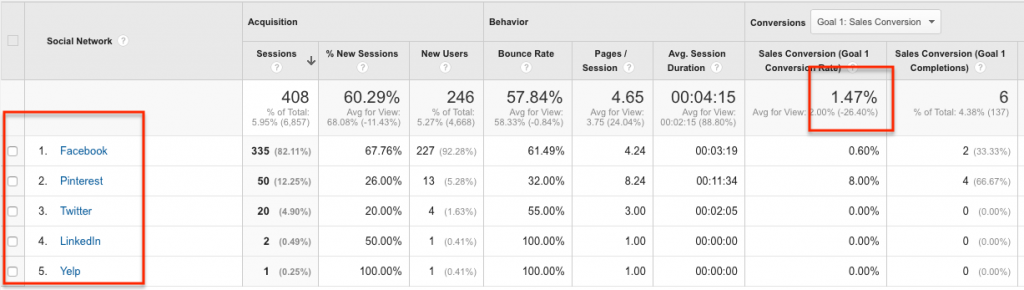
Our Social Media Channels improved as well and went from 1.13% to 1.47%.
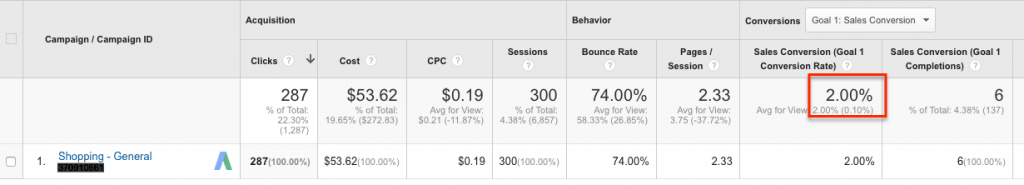
At this point, we decided to add Google Shopping for the client. This started generating income for them almost immediately.
Google Shopping, March, 2016
At the end of March we are beginning to feel good about the way the site was running and in understanding its performance.
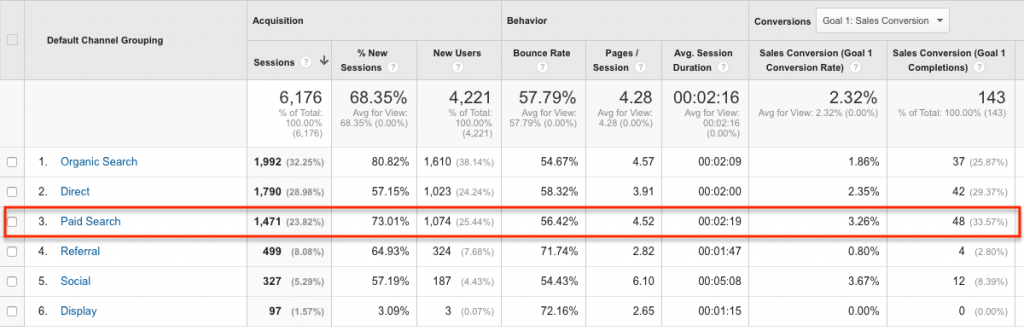
In April, sales continued to grow. The conversion rate went to 2.32% from the original 1.82%. In 2 months we were able to increase the conversion rate by 0.5% just by making adjustments based on Google Analytics reports.
While a half of a percent might not sound like much, from a conversion standpoint, that resulted in a 28% lift!
Imagine that – If we hadn’t set up Google Console and Google Analytics for the client and then consulted with them on where they needed to spend their efforts, they would’ve likely continued to operate blindly. And their website’s traffic and sales would have continued to suffer. That’s just not something that small business owners can afford.
Traffic Channels, April 2016 Report
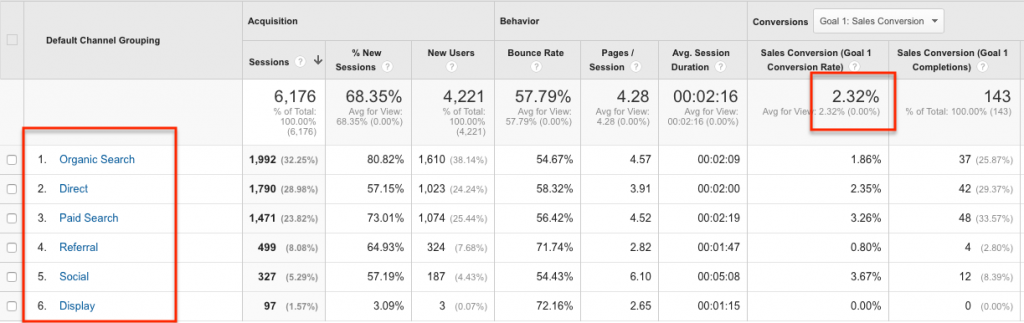
Through our continued analysis of the reports, we were able to learn that our client’s Twitter and Pinterest accounts were generating some really good sales. This directed our focus to ensure we actively maintained those accounts to drive more revenue through those channels. Check out the fruit of our labor in the report below.
Side Note: Notice how I continued to analyze Google’s metrics and Console data to drive our next steps. It’s critical that you consult these tools so that you’re not blindly implementing strategies or making changes that could yield nothing or worse, harm your website performance. These tools help you remain data-informed so you can plan your next steps to reap website success.
Social Media Channels, April 2016
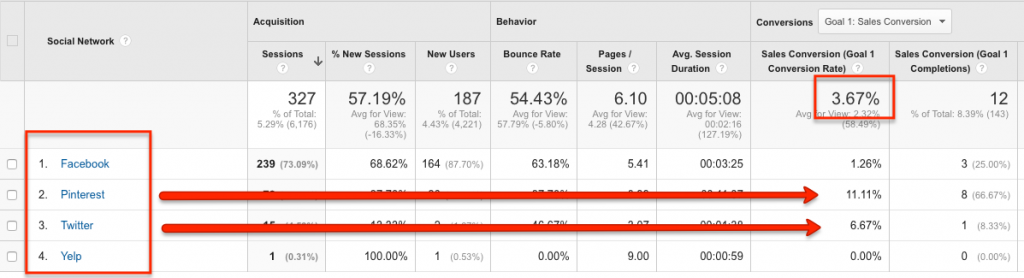
Here you see that Twitter jumped up from 0% to 6.67% and Pinterest from 8% to 11.11%. This is a 149.65% increase in just one month!
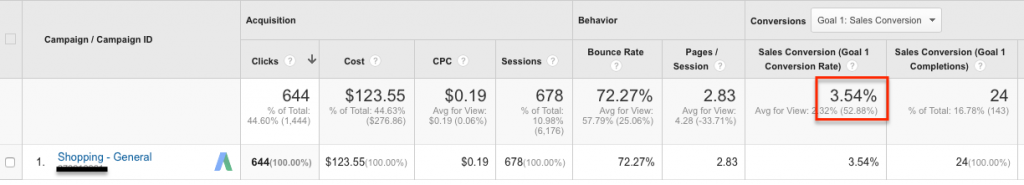
Google Shopping went up from 2% to 3.54%.
Google Shopping, April, 2016
All of this growth was happening mostly by analyzing Google Analytics. We’re currently in the middle building a new website for this client because we were able to identify many issues with the existing site that was stunting sales growth. Things like a large amount of dropoffs from the Shopping Cart page and Checkout page due to poorly designed pages and chaotic layouts.
Because of this, we decided to switch the client to a new Magento Shopping Cart system which is currently under development and should go live shortly.
This case study offers an example of how Google Analytics helps identify traffic and website performance to diagnose issues and make the proper adjustments.
In May, sales suddenly slowed down and we didn’t know why until we started comparing the last 3 months of reports together.
March 2016 – Conversion rate is 2.72%
April 2016 – Conversion rate is 3.26%
May 2016 – Conversion rate is 1.84%
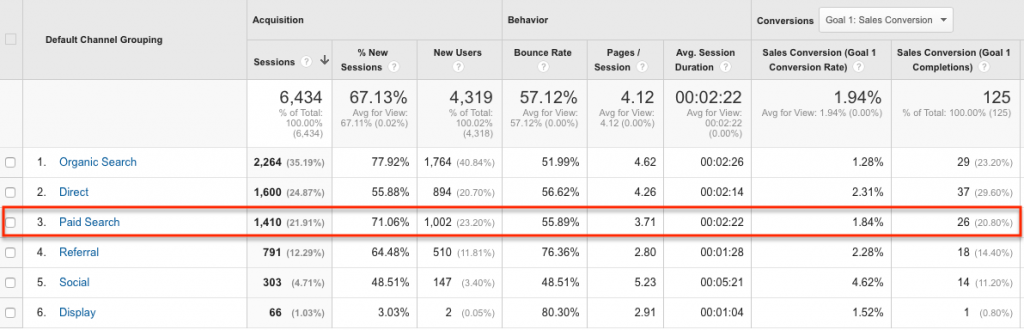
By having these statistics, I was able to learn that Paid Search conversion went down almost half from 3.26% to 1.84% during the last month. Since we are using an external company to do Google AdWords, the question is on them why the Paid Search performed so poorly that particular month.
Bottom line: Without access to Google Analytics, my client would not have known what is working and what is not when it came to his website. By teaching him how to read the reports, he is beginning to understand how the site operates and where we need to put extra work to maximize results. When there is a problem, it is critical to analyze it so you can accurately direct your troubleshooting efforts and this can only be done by having access to Google Analytics.

At Kinga Dow Productions, we help businesses with an online presence use digital strategies like search, social, sales funnels, and their website in a smart way to grow revenue. We do that by focusing on generating real results. That is, increasing the number of online visitors and improving the conversion of those visitors into paying customers.
We listen to you, understand your audience, and put our digital marketing expertise & sophisticated technology skill-sets to work for you in order to meet or exceed your business goals. Contact us today if you would like to talk about your Website Optimization Strategy.

Kinga Dow
Read More of Our Posts
-
Boosting Your Food Brand’s Success with Advanced Email Marketing Strategies Using Klaviyo
June 25, 2024In the competitive world of eCommerce, particularly within the food industry, effective email marketing can...
-

Strategies for Capitalizing on Traffic and Growth: Gamification, Social Engagement and Email Acquisition
April 4, 2024INTRODUCTION I’m back after a great week at Cosmoprof, Bologna. I’m ready to dissect all...
-
Act Now: Navigating Google and Yahoo’s Urgent Sender Requirements for 2024
January 30, 2024Introduction to New Email Marketing Compliance Standards In the digital marketing realm, delivering emails that...
-

The Crucial Difference Between Copywriters and Email Marketing Copywriters
January 30, 2024Introduction: In the ever-evolving landscape of digital marketing, the role of copywriters has diversified, with...
-

The Best Ecommerce Partners for Email Marketing: A KDP Guide
June 15, 202311 Best Apps for Building Up Your Klaviyo Ecosystem When it comes to email marketing,...
-

The Power of Technology in Beauty: A Marketer’s Perspective on Geske at Cosmoprof Show
April 5, 2023By leveraging technology, Geske can provide a one-of-a-kind experience that sets them apart from other...
-
How Davines Nailed Their Email Marketing Strategy at Cosmoprof Bologna!
March 27, 2023See how Davines, the sustainable hair care brand, executed a marketing strategy leveraging email! Cosmoprof...
-

Boost Your Email Marketing Strategy with Klaviyo and Google Ads
January 20, 2023Are you looking for ways to maximize your advertising spend? And reach more highly-qualified buyers?...
-

Discover How The Role of AI Is Growing In Business And How You Can Leverage It!
January 10, 2023As AI technology continues to advance, more and more businesses are turning to artificial intelligence...
-

Funnel Retail Traffic To Your Online Store & Boost Sales
June 30, 2022QR codes are a unique way to bridge your retail presence with your online presence....
-

Learn to Create Marketing Emails that Convince and Convert
April 3, 2019Email marketing is a powerful tool that can bring your online business great benefits. If...
-

MailChimp Ended the Partnership with Shopify.
March 25, 2019On the 22nd of March, MailChimp announced the end of their partnership with Shopify, because...
-
Predict When Your Customers Will Reorder
March 5, 2019Predict When Your Customers Will Reorder Are you eager to scale up your business? Of...
-

7 Must-Know Facts about the EU’s GDPR and Your Ecommerce Business
April 27, 2018GDPR stands for General Data Protection Regulation, a piece of law approved by the EU...
-

17 Tips to Maximize Your eCommerce Abandoned Cart Strategy
August 16, 2017Oftentimes, people are so busy that they miss significant opportunities to take their eCommerce business...
-
How To Setup Google Analytics Goals and Conversion Funnels
December 19, 2016Whether your online goal is to generate sales or it is to get signups for...
-

15 Best Elements For Any eCommerce Website That Wants To Drive Conversions
July 31, 2016The Problem I was hired to redesign this project when my Client and I noticed...